AARRR — how a pirate framework helps to increase the number of active users and product revenue
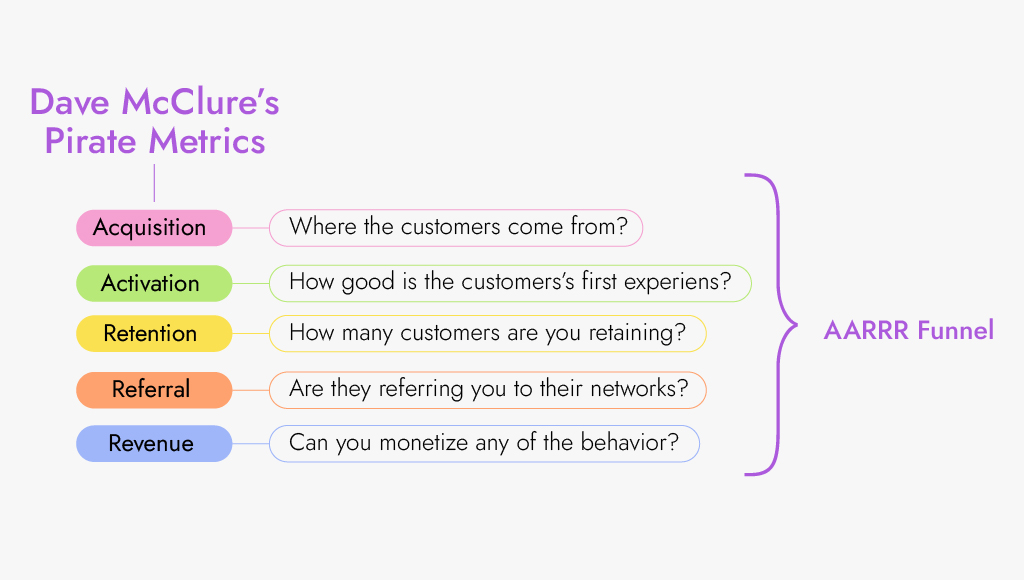
The AARRR framework is a tool that helps to increase two important indicators for a product: the number of active users and revenue. An alternative name is «Pirate metrics» due to the mnemonic’s resemblance to a pirate’s growl. It stands for five stages: Acquisition, Activation, Retention, Referral, and Revenue.
Dave McClure, a renowned entrepreneur and venture capitalist, created the AARRR framework. His idea was to create an actionable and easy-to-understand framework that would allow startups to focus on the essential aspects of customer interaction and business development. Dave’s work has had a significant influence on how both startups and established businesses approach growth and customer engagement.
Pirate metrics might be particularly useful for understanding:
- which channels are most effective for acquiring new users and how to turn those users into paying customers;
- which features or products retain users and generate referrals, which can be used for planning new offerings;
- how to design and optimize plans to maximize revenue.
How to use it
You can work step by step or swap them depending on the specifics of the product, the customer journey and business priorities.
For each stage, you need to make a plan:
1. Set a goal: what we want to get.
2. Form a hypothesis: how can we get it.
3. Determine the time to test the hypothesis.
4. Test the hypothesis: go through the PDCA cycle (plan → do → check → act).
5. Accept the solution as a standard or make new hypotheses and test them.
Examples of goals, hypotheses, and metrics for each stage
Acquisition
Goal: to find the channel of attracting users at the lowest cost .
Examples of hypotheses:
1. Launch an email newsletter.
2. Launch targeted advertising on social networks.
3. Launch contextual advertising.
4. Publishing twice a month on industry websites with high attendance.
Examples of metrics:
1. СPC — cost per click.
2.CPL — the cost of the lead.
3. СTR— clickability (the ratio of clicks to impressions).
4. Leads — the number of leads.
5. Bounce rate — users who left the site immediately after opening.
Activation
Goal: to engage the user in interaction with the product.
Hold him by the hand to the point where he figured out the product and was able to solve a problem or task with it: find a product, book a ticket, watch a movie, create a presentation.
Examples of hypotheses:
1. Create an onboarding that will make the product more understandable for users.
2. Simplify the registration process.
3. Offer a free-use month or a demo version.
Examples of metrics:
1. CR — conversions at each stage.
2. CPA — the cost of the useful action: registration, subscription, transition from the free to the paid version.
3. Engagement — duration and depth of the session.
4. Bounce rate.
Referral
Goal: to make users recommend the product.
If all the previous stages are worked out correctly, there should be no problems with this.
Examples of hypotheses:
1. Send a reminder about the review by email.
2. Give bonuses for recommendations.
3. Implement an affiliate program where the client will receive a reward for each user brought in.
Examples of metrics:
1. NPS — consumer loyalty index (measured through testing).
2. CSI — consumer satisfaction index (measured through testing).
Retention
Goal: to reduce the outflow of customers.
To reduce churn you need to understand why customers who used the product before stopped doing it.
Examples of hypotheses:
Launch a series of two or three emails.
1. Tell us how the functions that the client has already used have been improved, and how they can be used again.
2. Tell about successful cases of working with the product in social networks or mailing lists.
Examples of metrics:
1. Session duration — how long the user interacts with the product in one visit.
2. Returnability — how many users use the product repeatedly during the period.
3. Outflow — how many users stop using the product during the period.
Revenue
Goal: to get the first money from customers.
Examples of hypotheses:
1. Before using the free version, the user attaches the payment card. After the expiration date, the system debits the payment and the client switches to the paid version of the product.
2. Add links to a paid subscription to the free materials and briefly describe the benefits.
3. Set up push notifications that will inform the user about the limitations of the free version and offer to switch to the paid version.
Examples of metrics:
1. Growth of paid users.
2. LTV — profit from the client for the entire time of working with him.
3. Average check.
4. Total revenue for the period.
Example
Let’s consider an example of using a framework by a European startup for organizing a warehouse of personal things.
Acquisition
Goal: to find the channel with the most profitable conversion at all stages of the marketing funnel.
Hypotheses:
1. Mass media: television, radio.
2. Outdoor advertising.
3. Print advertising.
4. Social networks.
5. Contextual media networks.
6. Google.
7. Bing.
Result: according to the results of the tests, it turned out that Google, Bing and organic traffic were the most effective in terms of conversion.
Metrics:
1. CPM
2. CPC
3. The cost of going to the landing page.
4. The cost of the lead.
5. The cost of registration.
6. The cost of conversion to purchase.
7. Conversions at each stage of the funnel.
Activation
Goal: to increase the probability of a warehouse booking transaction by 20%
Hypotheses:
- Simplify the registration form
- Create a system for calling customers who have registered on the site, but have not booked a warehouse.
Result: simplified registration increased the probability of a transaction by 20%, and customer calls by 10%.
Metrics:
1. Conversions at every step of the funnel.
2. The cost of conversions at every step, divided into channels.
Revenue
Goal: to increase revenue by 10% in comparison with the previous quarter
Hypotheses:
- To fix barriers on the website to facilitate the transaction
- To call customers who have registered on the website, but have not booked a warehouse.
Result: website optimization allowed to increase revenue by 10%, while the creation of a calling system — by 5%
Metrics:
1. Conversion to purchase from each stage of the funnel.
2. The cost of attracting a client who has signed a contract with division by channels (including organic traffic).
3. The average cost of attracting a client who has signed a contract.
4. LTV — profit from one client for the entire time of working with him (by cohorts).
5. MRR (monthly recurring revenue) — total monthly income (by cohorts).
Retention
Goal: to increase the average duration of the contract by 25%.
Hypothesis:
1.We will give a discount for the extension
2.Let’s launch a useful newsletter
3. We will call the clients whose contract is ending
Result: Discount and calls increased the duration of partnership with clients by 10%. The newsletter did not affect the metrics.
Metrics:
1. Monthly renewal of contracts.
2. Cancellation of contracts.
3. LT — the duration of the product use by one client.
4. LTV — profit from one client for the entire time of working with him.
Referral
Goal: to increase the share of customers who came on the recommendation by 5%
Hypothesis:
1.Create a discount coupon system
Result: the share increased by 1%. Hypotheses need to be updated and tested again.
Metric:
1. The share of users who used coupons
Takeaway
The AAARR framework can guide a company through the entire customer journey, from the initial awareness stage to converting them into advocates for the brand. By setting clear goals, strategies, and measurements at each stage, it enables a structured and data-driven approach to growth marketing.
Related Posts

A few tips from Storist on how to read faster, understand better and retain more
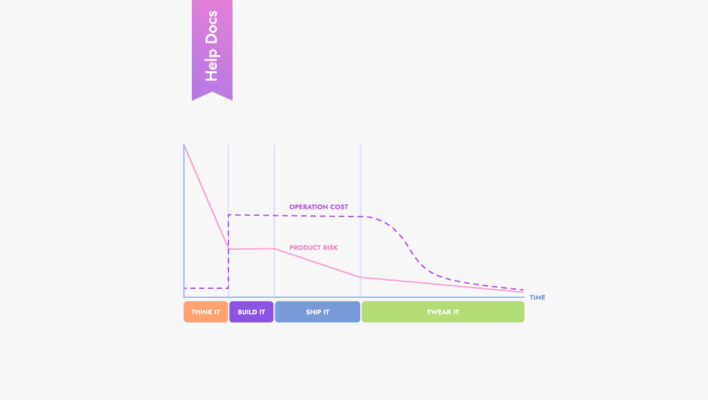
«Think It, Build It, Ship It, Tweak It»: The Four Stages of Product Development That Made Spotify a Great Company
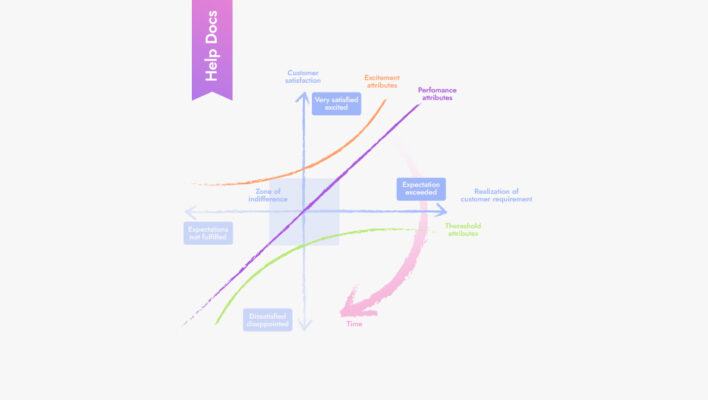
How the Kano model helps to understand what your customer is willing to pay for
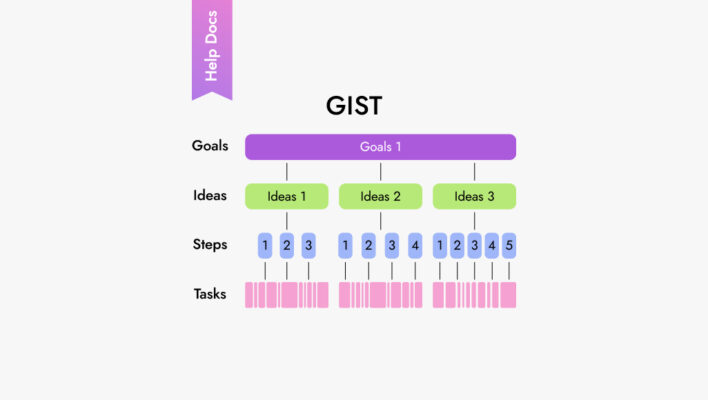
How the GIST framework allows you to abandon outdated product roadmaps
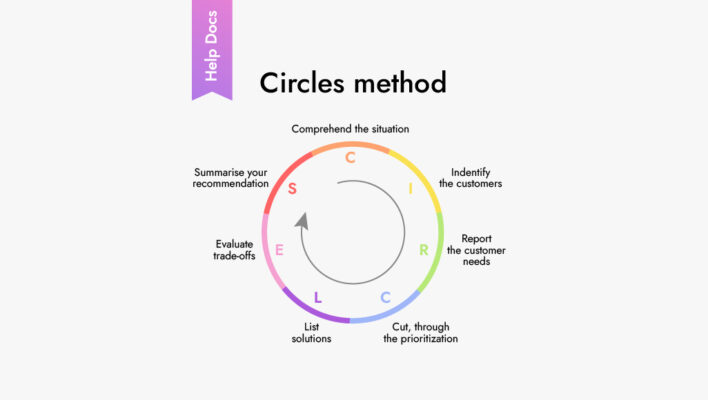
How the CIRCLES Method Help Product Managers in Problem Solving
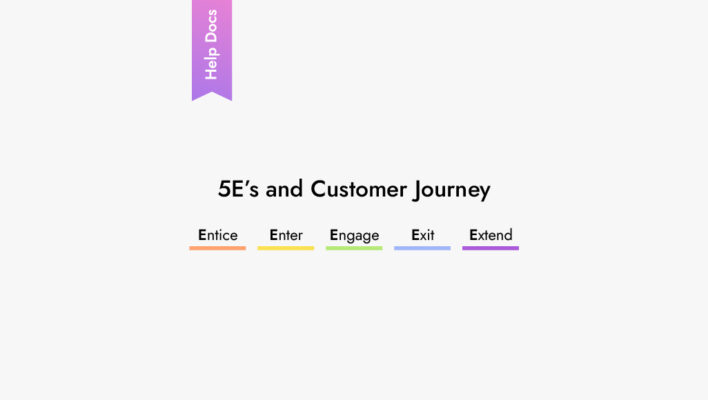
5 Es Model: A Comprehensive Guide to Customer Journey Map
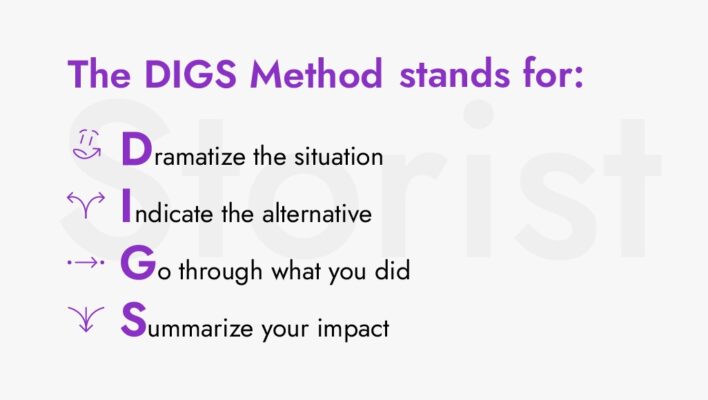
How the DIGS framework helps to pass interviews
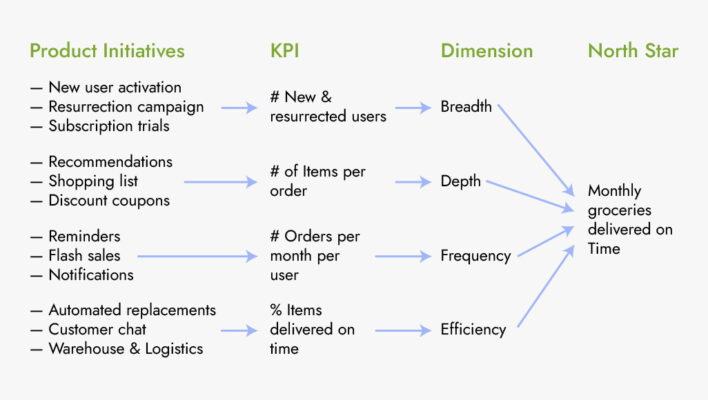
How the North Star framework can lead your company to success