How the Kano model helps to understand what your customer is willing to pay for
The Kano model allows companies to classify the functions of their products based on their value to the target audience and refine their customer offer.
Noriaki Kano, a researcher from Tokyo, faced the problem of measuring emotional reaction in the 80s while studying TV sales. He was looking for a way to understand what qualities they should have in order to please customers.
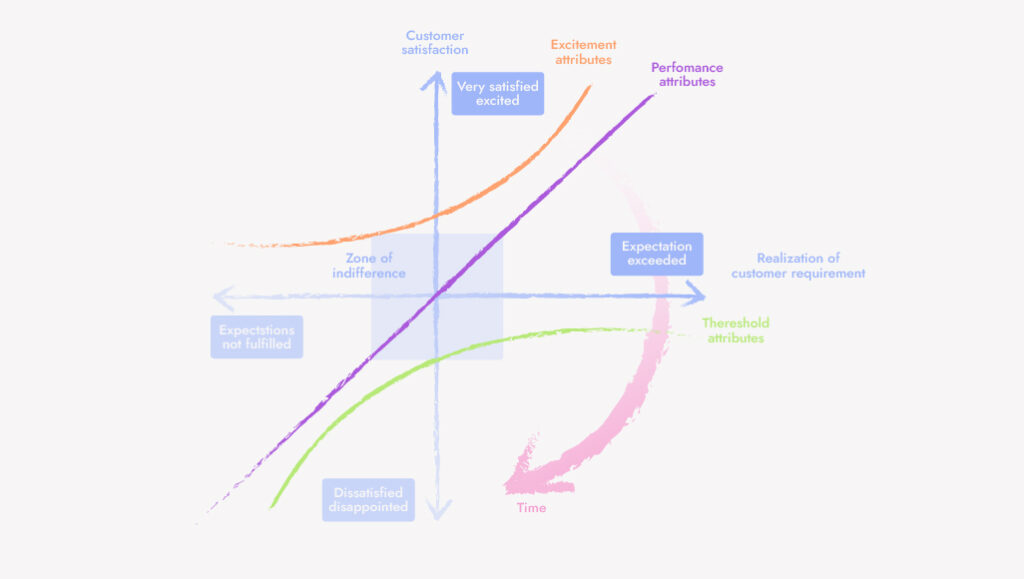
Before him, the American psychologist Frederick Herzberg found out about and wrote in his book «Motivation to work» that the attitude of consumers to the qualities of the same product is formed in two different ways. «Hygienic» qualities are perceived as something obvious, and the absence of such is frustrating. «Motivational» qualities are not a necessity, but they are pleasing if they exist.
Knowing these features of perception, Kano came up with a scheme in which on the X axis is the degree of realization of one specific property of the product, and on the Y axis is the emotional reaction of the consumer to it from negative to indifferent and from indifferent to positive.
This model helps to develop only the product properties that are important to the client, saving time and resources. In addition, research within the Kano model helps to create the best products on the market.
Let’s figure out how it works!
How to use it
Kano divided the needs of customers into several groups:
- Must-be. These are the main qualities of the product, inherent in them by default
- Performance. Features, the level of implementation of which directly affects the level of customer satisfaction
- Attractive. It is something unexpected for the consumer, a killer feature
- Indifferent. These are features, the presence or absence of which does not affect anything
- Questionable. These are most likely incomprehensible features, they should be rechecked
- Reverse. Qualities that repel the product.
The first thing you need to do is make a list of all the characteristics of your product that you want to focus users’ attention on. Usually they take no more than 20 functions. Each feature should be described as clearly as possible. It is ideal to show in pictures/ screenshots what exactly you are asking for.
Next, you will need to conduct a survey, the results of which will then be correlated with the six categories above. To conduct a survey, you can use any of the tools available on the market. For example, Surveys from Google. It can help you set the necessary types of answers in them, and also to attach an image inside the description of each of the ideas.
In order to assess the impact of a certain function on subjective quality, you can use these questions:
Positive wording
If the product HAS a {property or function}…
- I will really like it!
- This is normal, this is how it should be
- I don’t care
- I don’t need it, but it won’t bother me either.
- I don’t need it, it will bother me!
Negative wording
If there is NO {property or function} in the product…
- It’s very good that this is not there!
- This is normal, it shouldn’t be
- I don’t care
- I need it! But I’ll survive without it.
- I need it! It’s too bad that it doesn’t exist.
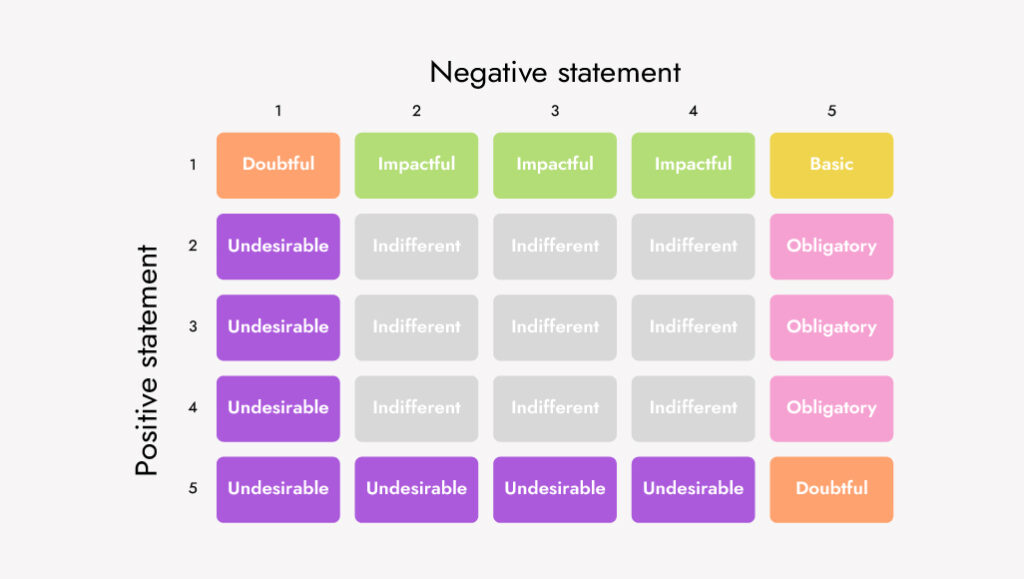
Now we need to draw conclusions based on them. To do this, you need to create a logical table. If a person answered 5 and 5 or 1 and 1 to both questions, then this answer contradicts itself — we will mark such a combination as doubtful. The remaining pairs of answers tell us which category according to Kano a particular buyer refers to the quality of the product.
Next, we make up a frequency table, where we indicate the properties in the rows and in the columns depending on which Kano-category this property was attributed by a potential buyer. In the cells we indicate the number of corresponding responses, for example, as a percentage. The largest number in the line just shows which category according to Kano a particular quality of the product belongs to.
As a result, it becomes clear what are the primary qualities of the product, which are secondary, and which ones are not necessary at all.
If the product function has been assigned to two or more categories the same number of times, then it must be placed in the category with the highest value in accordance with the following order:
- Must-be.
- Performance.
- Attractive.
- Indifferent.
Example
Let’s say your company is engaged in UX design for a new messenger, the target audience of which is teenagers. In order to understand which functions the product needs, and which do not need to be spent time on, you need to use the Kano model.
First you have to make a list of the design features of the future messenger. For example, dialogs, calls, stickers, an interface with a large font, stories, the ability to analyze the sender’s mood based on AI text analysis, and so on.
Then, using the survey service, you poll the audience. For each function, you have to ask two questions.
For example:
A useful, functional question.
If the product HAS stickers…
- I will really like it!
- This is normal, this is how it should be
- I don’t care
- I don’t need it, but it won’t interfere either.
- I don’t need it, it will interfere with me!
Useless, dysfunctional question.
If there are NO stickers in the product…
- It’s very good that this is not there!
- This is normal, it shouldn’t be
- I don’t care
- I need it! But I’ll survive without it.
- I need it! It’s too bad that it doesn’t exist.
For example, we analyze 10 functions for an audience of 100 people. Each survey participant answers two questions for each function. Then we need to create a logical table. The numbering of columns and rows corresponds to the order of the answers to the questions. It doesn’t matter how many functions you analyze. Since the table data is linked to the answers to the questions, the names of the table cells will always be the same.
For example, one of the respondents, answering questions about stickers, chose option 1 when answering an affirmative question and option 2 when answering a negative question. We look at where these answer options intersect and understand that for the respondent, the presence of stickers in the messenger is an attractive characteristic.
Next, we make up a frequency table, where we indicate the product functions in the rows, and in the columns — to which Kano-category this function was attributed by a potential buyer. In the cells we indicate the number of corresponding responses, for example, as a percentage.
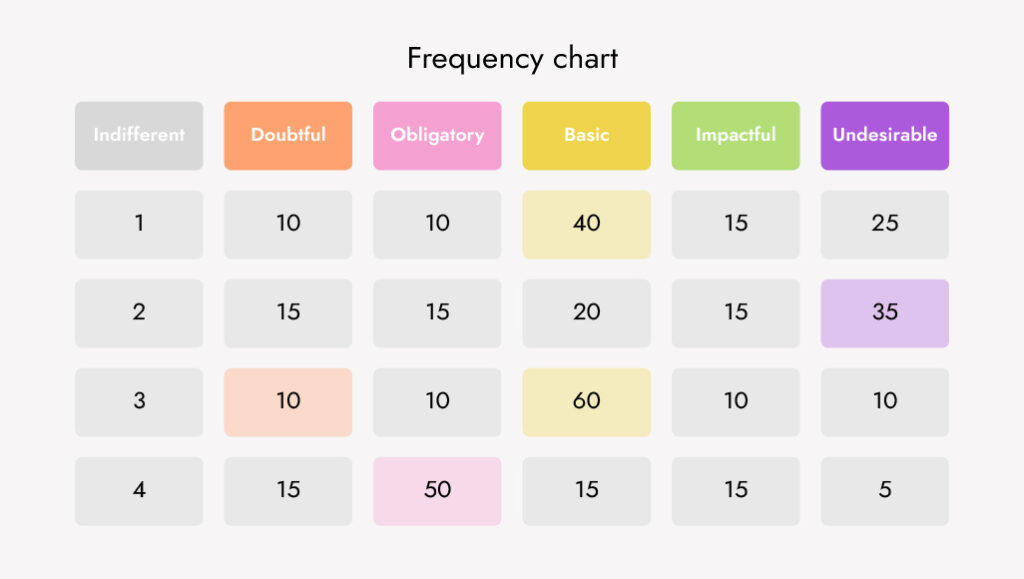
So, as a result, we see that for most of the audience of the future messenger, the presence of stickers is necessary.
Takeaway
The Kano model is one of the most useful marketing tools. It helps to separate important product functions from unnecessary ones, which saves time and money during the development process. Join Storist to learn about other useful tools that will help you achieve your goals!
Related Posts

A few tips from Storist on how to read faster, understand better and retain more
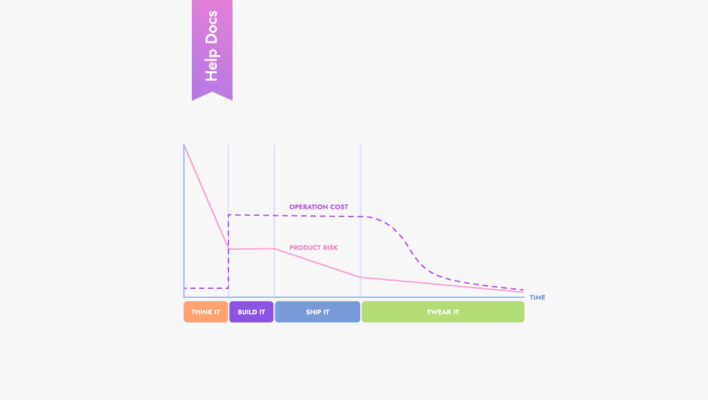
«Think It, Build It, Ship It, Tweak It»: The Four Stages of Product Development That Made Spotify a Great Company
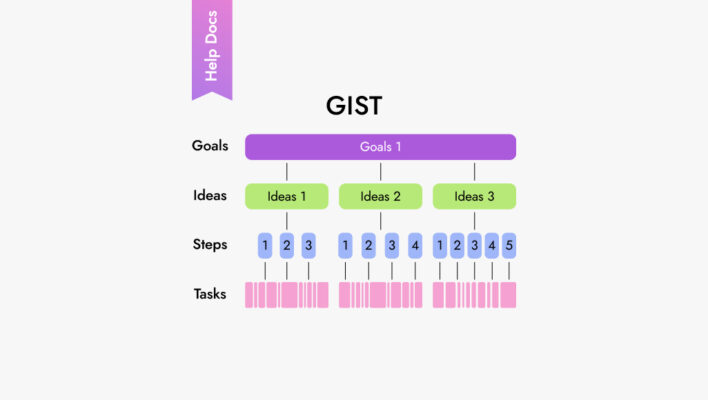
How the GIST framework allows you to abandon outdated product roadmaps
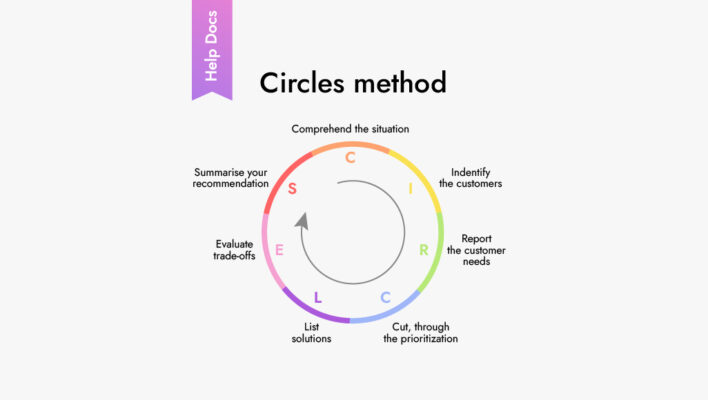
How the CIRCLES Method Help Product Managers in Problem Solving
5 Es Model: A Comprehensive Guide to Customer Journey Map
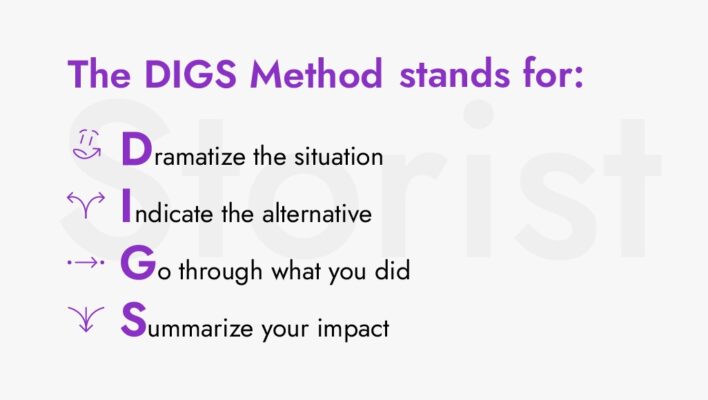
How the DIGS framework helps to pass interviews
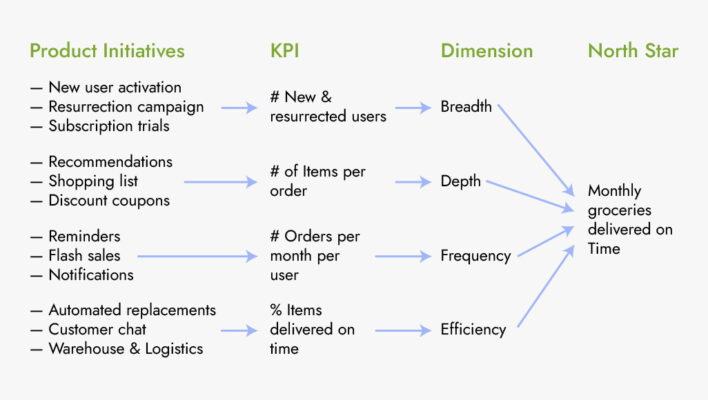
How the North Star framework can lead your company to success
A new economic crisis is already knocking on the door. How to keep cool and stay afloat?